
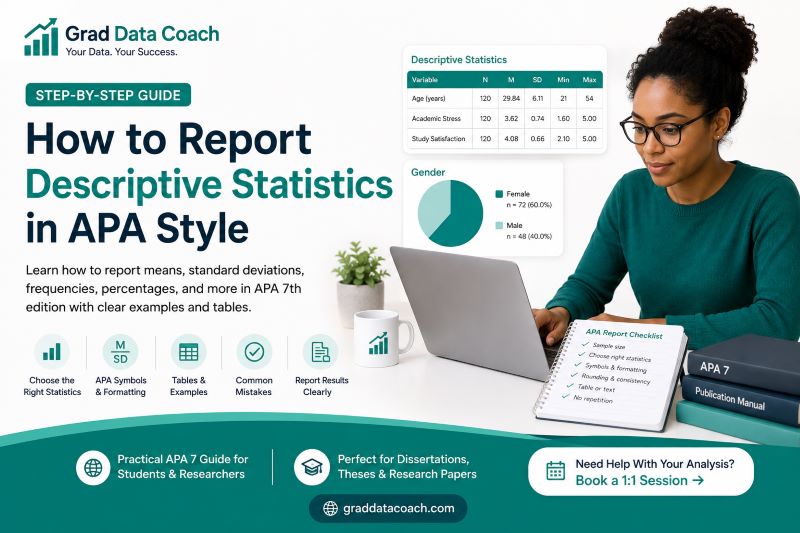
Descriptive statistics are usually among the first results you report in a quantitative research paper, dissertation, or thesis. They summarize your sample and main variables before you move on to tests such as t-tests, ANOVA, correlation, or regression. However, deciding which statistics to report and how to present them in APA style can be confusing.
This guide explains how to report descriptive statistics in APA style using clear, beginner-friendly steps. You will learn when to report the mean, standard deviation, median, frequencies, percentages, and other common statistics. We will also cover APA statistical symbols, rounding, descriptive statistics tables, SPSS output, and complete reporting examples.
By the end, you should be able to choose suitable descriptive statistics for your data and report them clearly in your results section.
What Are Descriptive Statistics?
Descriptive statistics summarize the data collected in your study. They help readers understand your sample and the main variables before you begin testing hypotheses or answering more complex research questions.
For example, if you survey university students, descriptive statistics can tell you their average age, how many participants belong to each demographic group, and the average score on a questionnaire. These statistics describe what you observed without making conclusions about a larger population.
The most common descriptive statistics include:
- Mean. The arithmetic average of a set of numerical scores.
- Standard deviation. Shows how much the scores tend to vary around the mean.
- Median. The middle value after the observations have been arranged in order.
- Minimum and maximum. Show the lowest and highest observed values.
- Range. Shows the difference between the lowest and highest values.
- Frequency. The number of observations within a category.
- Percentage. The proportion of the sample within a category.
Which statistics you report depends on the type of variable and how the data are distributed. Therefore, you should not automatically use the mean and standard deviation for every variable.
Which Descriptive Statistics Should You Report?
The first step is to decide which statistics best describe each variable. Your choice should depend on the type of data you have and, for numerical variables, how the values are distributed.
A useful starting point is:
| Type of data | Descriptive statistics commonly reported |
|---|---|
| Continuous or approximately symmetric numerical data | Mean and standard deviation |
| Categorical data | Frequency and percentage |
| Strongly skewed numerical data | Median and interquartile range or quartiles |
| Ordinal data | Frequencies, percentages, median, or other suitable summaries |
| Numerical data where the observed limits matter | Minimum and maximum |
| Data compared across groups | Sample size and suitable descriptive statistics for each group |
For instance, age may be summarized using a mean and standard deviation when the distribution is reasonably suitable. Employment status, on the other hand, is categorical and is better described using frequencies and percentages.
A strongly skewed variable may require the median rather than the mean because extreme observations can pull the mean away from the center of the distribution.
The main question to ask is simple: Which statistics give readers the clearest picture of this variable?
APA Symbols for Descriptive Statistics
APA style uses standard statistical symbols to keep statistical reporting concise. Learning the most common symbols makes it much easier to write your results section.
| Statistic | Symbol |
|---|---|
| Mean | M |
| Standard deviation | SD |
| Total sample size | N |
| Subgroup sample size | n |
| Median | Mdn |
Statistical symbols such as M, SD, N, and n are normally italicized. However, the numbers, equals signs, parentheses, and percentage signs remain in regular type.
There is also an important difference between N and n. Use uppercase N for the total sample and lowercase n when referring to a subgroup.
For example, a study might contain N = 150 participants overall, with n = 86 participants in one category.
You do not have to use a statistical symbol every time you mention a value. If writing “the mean age was…” makes the sentence easier to read, use the words naturally. APA reporting should be clear rather than unnecessarily mechanical.
How to Report the Mean and Standard Deviation in APA Style
The mean and standard deviation are commonly reported together for numerical variables. The mean shows where the scores are centered, while the standard deviation gives readers an idea of how much the scores vary.
A common APA-style format is:
Description of the result (M = value, SD = value).
For example:
Participants had a mean age of 29.84 years (SD = 6.11).
You can also report both statistics within parentheses:
Participants reported moderate levels of academic stress (M = 3.62, SD = 0.74).
When comparing groups descriptively, report the relevant mean and standard deviation for each group. For example:
Full-time students had a mean stress score of 3.74 (SD = 0.69), while part-time students had a mean score of 3.42 (SD = 0.77).
Notice that this sentence only describes the observed values. You should not say that one group scored significantly higher unless an appropriate inferential test shows a statistically significant difference.
In most cases, reporting the standard deviation alongside the mean gives readers a much clearer understanding of the data.
How Many Decimal Places Should You Use?
Rounding makes statistical results easier to read, but you should keep enough precision to represent the data accurately.
For many descriptive statistics, one or two decimal places provide a useful level of precision. For example:
- M = 3.47, SD = 0.82
- M = 68.4 kg, SD = 9.7
- n = 84
Counts such as sample sizes are whole numbers and should not be reported as values such as n = 84.00.
The level of precision may also depend on the variable. Reporting an age as 29.84327 years would usually add little useful information, while a measurement taken with a highly precise scientific instrument may require more decimal places.
Consistency also matters. If several means appear in the same table, they should normally use the same level of precision unless there is a clear reason not to do so.
Finally, check your university, department, supervisor, or target journal because they may provide more specific rounding requirements.
How to Report Frequencies and Percentages in APA Style
Frequencies and percentages are commonly used for categorical variables. These may include gender, employment status, education level, treatment group, marital status, or yes/no responses.
Suppose your sample contains 120 participants, including 72 women and 48 men. You could report:
The sample included 72 women (n = 72, 60.0%) and 48 men (n = 48, 40.0%).
Reporting both the frequency and percentage helps the reader understand the actual number of observations as well as their proportion within the sample.
This approach works well when you only have a few categories. However, a paragraph can become difficult to read if you try to describe several demographic variables with many categories.
In that situation, use a table to present the detailed frequencies and percentages. You can then use the accompanying paragraph to highlight only the characteristics that are important for understanding the sample.
This avoids filling the results section with long strings of numbers while still providing readers with the information they need.
How to Report the Median and Measures of Spread
The mean is useful for many numerical variables, but it is sensitive to extreme values. When the distribution is strongly skewed, the median may provide a better description of the typical observation.
The median represents the middle value after the observations have been arranged from lowest to highest.
For example:
The median weekly study time was 12 hours (Mdn = 12).
A median is often more useful when a small number of unusually high or low observations would distort the mean. Variables such as income, waiting times, or hospital stays can sometimes have this type of distribution.
You may also report quartiles or the interquartile range to describe the spread of the middle portion of the data. Alternatively, the minimum and maximum can be useful when readers need to know the full observed limits.
For example:
Participants were between 21 and 54 years old.
You do not need to report every possible measure of center and spread. Choose the statistics that best describe the variable and give readers information that is relevant to your research.
How to Report Descriptive Statistics in the Results Section
Descriptive statistics usually appear near the beginning of a quantitative results section. They give readers enough information about the sample and variables to understand the analyses that follow.
A logical order is:
- Report the final sample size.
- Describe important demographic characteristics.
- Present descriptive statistics for the main study variables.
- Mention relevant missing-data information if necessary.
- Move to the analyses used to answer the research questions or hypotheses.
For example:
The final sample consisted of 120 graduate students. Participants had a mean age of 29.84 years (SD = 6.11), with ages ranging from 21 to 54 years. Most participants were women (n = 72, 60.0%). The mean academic stress score was 3.62 (SD = 0.74), while the mean study satisfaction score was 4.08 (SD = 0.66).
This paragraph provides useful background before the reader reaches the inferential analysis.
At this stage, focus on describing the data. Broader explanations about why the results occurred usually belong in the discussion section rather than the descriptive statistics section.
How to Create an APA Descriptive Statistics Table
A table is often the clearest way to report descriptive statistics when your study contains several variables. Instead of placing many means and standard deviations into a long paragraph, readers can compare the values quickly in one place.
A simple descriptive statistics table might look like this:
Table 1
Descriptive Statistics for the Main Study Variables
| Variable | N | M | SD | Min | Max |
|---|---|---|---|---|---|
| Academic stress | 120 | 3.62 | 0.74 | 1.60 | 5.00 |
| Study satisfaction | 120 | 4.08 | 0.66 | 2.10 | 5.00 |
| Research self-efficacy | 120 | 3.79 | 0.71 | 1.80 | 5.00 |
Place the table number above the table and follow it with a clear, descriptive title. Column headings should tell readers exactly what each value represents.
You should also introduce the table in your text. For example, you might write, “Table 1 presents the descriptive statistics for the main study variables.”
Avoid repeating every value from the table in the surrounding paragraph. Instead, use the text to highlight patterns that deserve the reader’s attention.
How to Report Demographic Descriptive Statistics
Demographic statistics describe the people or cases included in your sample. Because many demographic variables are categorical, frequencies and percentages are commonly used.
For example:
Table 2
Demographic Characteristics of Participants
| Characteristic | n | % |
|---|---|---|
| Women | 72 | 60.0 |
| Men | 48 | 40.0 |
| Full-time students | 78 | 65.0 |
| Part-time students | 42 | 35.0 |
You could then summarize the most important characteristics in the text:
Most participants were women (60.0%) and studying full time (65.0%). The mean age of the sample was 29.84 years (SD = 6.11).
This approach is much easier to read than repeating every number from the table in a paragraph.
The demographics you report should also be relevant to your study. A software package may produce frequencies for every variable in the dataset, but that does not mean each one belongs in your paper.
Choose demographic information that helps readers understand the sample and evaluate the context of your findings.
Should Descriptive Statistics Come Before Inferential Statistics?
In most quantitative studies, descriptive statistics come before inferential statistics. This order allows readers to understand the basic characteristics of the data before seeing tests of differences, relationships, or predictions.
Suppose you want to compare academic stress between full-time and part-time students using an independent samples t test. Before reporting the t test, it helps to show the mean and standard deviation for each group.
For example:
Full-time students had a mean stress score of 3.74 (SD = 0.69), compared with 3.42 (SD = 0.77) among part-time students.
After describing those values, you can report the t test that evaluates whether the observed group difference is statistically significant.
The same principle applies to ANOVA, correlation, regression, and many other analyses. Descriptive statistics show readers what the data look like, while inferential statistics help you evaluate specific research questions or hypotheses.
Presenting the information in this order creates a more natural flow through the results section.
How to Turn SPSS Descriptive Statistics Into APA Style
SPSS can calculate descriptive statistics quickly, but its default output is not the same as an APA-style results section. You need to identify the relevant values and present them in a clear format.
Suppose the SPSS Descriptives table gives you:
- N = 120.
- Mean = 3.6184.
- Standard deviation = 0.7362.
- Minimum = 1.60.
- Maximum = 5.00.
You could report:
Participants had a mean academic stress score of 3.62 (SD = 0.74).
If the observed limits are important, you might add that scores ranged from 1.60 to 5.00.
Notice that we did not copy the complete SPSS table. Instead, we selected the statistics needed by the reader and rounded them to a sensible level of precision.
The same principle applies to SPSS Frequencies output. Extract the relevant counts and percentages, then present them in your own sentence or APA-style table.
Have SPSS output but are unsure what should go into your results section? We can work through it together using your own research.
Book a 1:1 Data Analysis Session →
Complete APA Descriptive Statistics Example
Suppose a researcher surveyed 120 graduate students to examine academic stress and study satisfaction. The study also collected information about age, gender, and study status.
An APA-style descriptive results paragraph might read:
The final sample consisted of 120 graduate students. Participants had a mean age of 29.84 years (SD = 6.11), with ages ranging from 21 to 54 years. Women accounted for 60.0% of the sample (n = 72), while men accounted for 40.0% (n = 48). The mean academic stress score was 3.62 (SD = 0.74), and the mean study satisfaction score was 4.08 (SD = 0.66).
Notice the order of information. The paragraph begins with the total sample, moves to basic demographic characteristics, and then introduces the main study variables.
If the researcher had several additional variables, placing their descriptive statistics in a table would make the results easier to read. The paragraph could then highlight only the most relevant patterns instead of listing every statistic.
Step-by-Step: How to Report Descriptive Statistics in APA Style
If you already have your statistical output, you can use the following process to turn it into a clear results section.
- Identify the type of each variable. Determine whether it is numerical, categorical, ordinal, or another type.
- Choose suitable descriptive statistics. Select means and standard deviations, frequencies and percentages, medians, or other summaries as appropriate.
- Check the sample size. Make sure you know how many observations contributed to each result, especially when missing data are present.
- Review the distribution where necessary. Decide whether the mean is an appropriate measure of center for numerical variables.
- Round your results consistently. Keep enough precision to communicate the findings without unnecessary digits.
- Use the correct APA symbols. Format symbols such as M, SD, N, n, and Mdn consistently.
- Choose between text and a table. Use text for a few statistics and a table when several values need to be compared.
- Check for unnecessary repetition. Avoid presenting the same complete set of values in both the text and table.
Following these steps helps turn raw software output into results that are much easier for readers to understand.
Common Mistakes When Reporting Descriptive Statistics
Descriptive statistics are straightforward once you understand the basic rules, but several common mistakes can make a results section difficult to read.
Watch out for the following:
- Reporting only the mean. Include a suitable measure of variability, such as the standard deviation, when it adds useful information.
- Using means for categorical variables. Frequencies and percentages are usually more appropriate for categories.
- Copying raw software tables. Extract the relevant results and present them in a clean APA-style format.
- Using unnecessary decimal places. Values such as M = 3.618427 rarely improve understanding.
- Reporting percentages without counts. Including both n and % often gives readers a clearer picture.
- Repeating the whole table in the text. Highlight important findings instead of describing every cell.
- Calling a descriptive difference significant. Statistical significance requires an appropriate inferential test.
- Interpreting results too early. Keep the results focused on what you found and save broader explanations for the discussion when appropriate.
Before submitting your paper, read the descriptive section as if you were seeing the study for the first time. The main characteristics of the sample and variables should be easy to understand.
Descriptive Statistics Reporting Checklist
Before moving on to your inferential analysis, check that your descriptive statistics section is complete and consistent.
- The sample size is clear. Readers know how many observations contributed to the analysis.
- Each statistic fits the variable. You have chosen appropriate summaries rather than automatically reporting means.
- Means include useful variability information. Standard deviations are included where appropriate.
- Categorical variables use counts and percentages. Readers can see both the number and proportion of observations.
- Rounding is consistent. Comparable values use a sensible level of precision.
- APA statistical symbols are formatted correctly. Symbols such as M, SD, N, and n are used consistently.
- Tables are easy to understand. Titles and headings clearly identify the information being reported.
- The text does not duplicate entire tables. Only important values or patterns are highlighted.
- Descriptive results remain descriptive. You have not claimed statistical significance without an inferential test.
- Your university requirements have been checked. Department or journal instructions are followed where they differ.
Once these points are in place, you can move more confidently into your hypothesis tests and other inferential analyses.
Need Help Reporting Descriptive Statistics From Your Own Data?
Reading an APA reporting example is useful, but applying it to your own research can still be difficult. Your dataset may contain several scales, demographic variables, missing observations, multiple groups, or statistical output that looks different from the examples in this guide.
During a private 1:1 coaching session, you can bring your own SPSS, R, Stata, Excel, or other statistical output. We can work through which descriptive statistics you should report, what the values mean, how to organize them in your results section, and what analysis should come next.
If you are completing a Master’s dissertation or thesis, explore our data analysis help for Master’s students. Doctoral researchers can also learn more about our PhD data analysis help, while students working specifically on a results chapter can explore our dissertation data analysis help.
Book a Private 1:1 Data Analysis Session →
Frequently Asked Questions
You italicize the statistical symbols M and SD, not the numerical values or punctuation around them. For example: M = 3.62, SD = 0.74.
One or two decimal places are common for many descriptive statistics, but the appropriate precision depends on the measurement and your field. Keep enough precision to represent the result accurately and use consistent rounding for comparable statistics.
The median can be more informative when numerical data are strongly skewed or contain extreme observations that would distort the mean. In these cases, include an appropriate measure of spread when it helps describe the distribution.
Use text when you only have a few important statistics to report. A table is usually clearer when several variables, groups, or categories need to be summarized. Avoid repeating every value from the table in the surrounding text.
N generally refers to the total sample, while n refers to a subgroup or part of the sample. For example, you might have N = 120 overall and n = 72 participants in one category.
Usually, yes. Descriptive statistics give readers an overview of the sample and variables before you report inferential analyses such as t tests, ANOVA, correlation, or regression.
